Visualizing SVN workflow using github-like network graphs
· One min read

Recently I found a need to visualize the way our team works with the SVN repository. I really like GitHub network graphs, so I started looking for a way to draw custom ones.
Luckily i found a raphaeljs (JavaScript library for vector graphics) demo which did exactly what I wanted. I had to tweak it a bit, like making labels show all the time, and making custom commits.
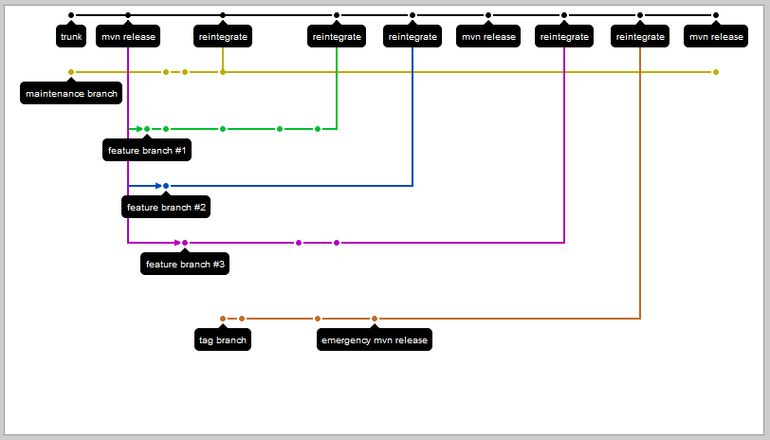
SVN workflow visualized as a GitHub-like network graph
You can find the changes I made in this repo. You can also take a look at the source code of the original raphaeljs GitHub demo.