Hello,
while the code for generating charts for the status page and the profiling page was more or less trivial, code for the query results will be more complicated. This is because of the dynamic data structure that query results can have. You can get any number of rows and columns as a result. Also the data in the result is composite - there are strings, numbers, dates, etc.. Not everything is suitable for one chart or another.
I decided to introduce two (for now) query result formats that must be followed when you want to put your data to the charts. If this format is followed code will recognize that and will render a chart which suits best.
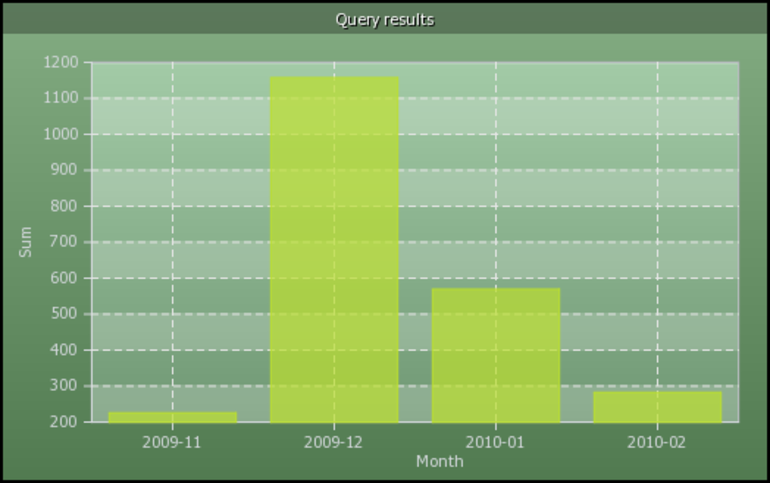
For now I will be talking about two types of charts: simple bar charts and stacked bar charts. For the simple bar chart we need to provide X and Y axis value pairs, something in a lines of this:
| Month | Sum |
|---|
| 2009-11 | 225 |
| 2009-12 | 1157 |
| 2010-01 | 569 |
| 2010-02 | 282 |
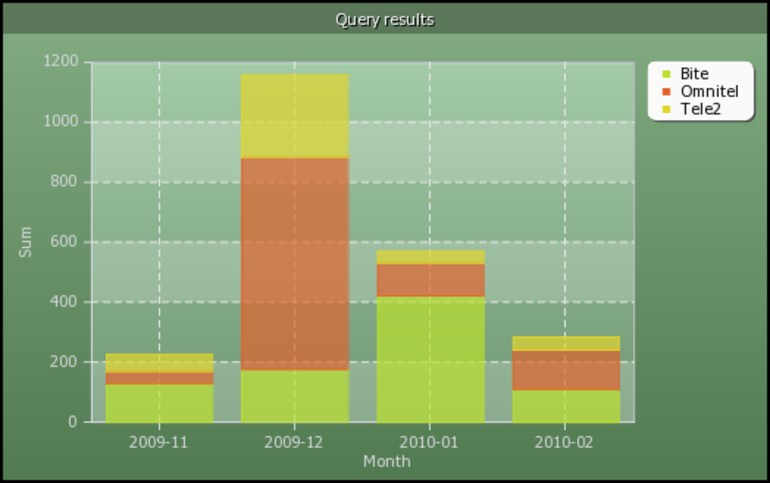
Now this is easy. What if we know that the total amount on every month is composed of different parts and we would like to see them in the chart as well. For this we will have to add another column which specifies which component the data belongs to. This breaks the monolithic bars into the bars composed of series of data.
| Month | Sum | Operator |
|---|
| 2009-11 | 129 | Bite |
| 2009-11 | 40 | Omnitel |
| 2009-11 | 56 | Tele2 |
| 2009-12 | 176 | Bite |
| 2009-12 | 707 | Omnitel |
| 2009-12 | 274 | Tele2 |
| 2010-01 | 422 | Bite |
| 2010-01 | 108 | Omnitel |
| 2010-01 | 39 | Tele2 |
| 2010-02 | 110 | Bite |
| 2010-02 | 131 | Omnitel |
| 2010-02 | 41 | Tele2 |
For this data generated chart would look like this:
Note that for both charts labels for X and Y axis were taken from the column names. It is nice to have such details taken from the query result. However I would also imagine that some users would prefer to set details like these in the chart generation page. I will be adding some options there which will have default values but will give the ability to change them to whatever you like.
So If you would like to put your data to these gorgeous charts generated by pChart just write a MySQL query which puts your data to the formats described above and you are done. Any other chart types which are suitable for query results?